Client Statistics is very important. Many a time, people relate queries execution plan with query cost. This is not a good comparison. Both are different parameters, and they are not always related. It is possible that the query cost of any statement is less, but the amount of the data returned is considerably large, which is causing any query to run slow. How do we know if any query is retrieving a large amount data or very little data? In one way, it is quite easy to figure this out by just looking at the result set; however, this method cannot be relied upon all the time as it is difficult to reach a conclusion when there are many columns and many rows.
To measure how much data is retrieved from server to client side is very simple. SQL Server Management Studio has feature that can measure client statistics. There are three different ways to enable client statistics.
Method 1
Press SHIFT+ALT+S together.
Method 2
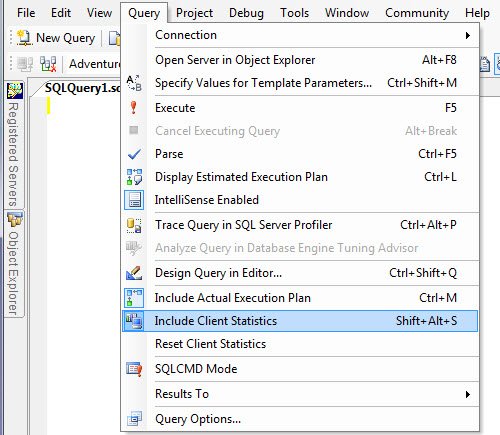
Go to Menu >> Query >> Include Client Statistics

Method 3

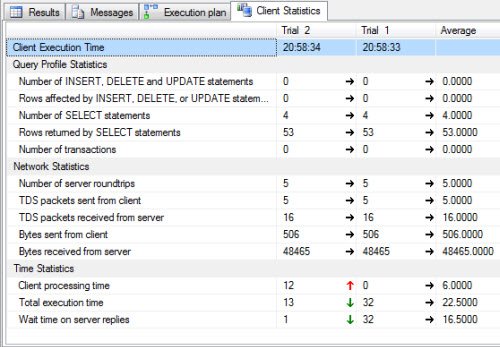
Once you enable the client statistics, it will display another tab in the result span; when clicked, we obtain the following:

As shown in the image, it will capture details for different trials and they are compared with each other. Green arrows indicate improved statistics and red arrows indicate degrading statistics. Please note that here an increase does not always imply a good result; sometimes some statistics when marked as “up” can imply a bad result as well. For the same reason, they are colored in green and red, signifying good and bad results, respectively.
A maximum of 10 trials are averaged in the display window. When the11th trial comes into the result, the very first trial is dropped, keeping total average of latest 10 trials. There are many other aspects about client statistics; these shall be discussed in other articles.
No comments:
Post a Comment